 Written by
 We presented our vision of the next 20 years of the TouchPoints data. We call it ChatPoints.
On this page
On 1 July 2026, the Institute of Practitioners in Advertising (IPA) gathered a room full of media planners, strategists and researchers at Picturehouse Central in London to mark twenty years of TouchPoints. We were there to show them something new: an AI that has TouchPoints built into its core. We call it ChatPoints.
About the TouchPoints at 20 event
“TouchPoints at 20” was the IPA’s celebration of two decades of its cross-media dataset: “an unmatched view of how audiences think, move, behave and engage,” as the IPA puts it. The morning ran from a networking breakfast through case studies from Ipsos, EssenceMediacom and Initiative, a session on the AI-powered future of the data, and a closing panel on “Humans, data, and decisions.”
FloreData took the AI slot. We had roughly fifteen minutes to present a demo, and we used it to argue that this year will be pivotal in shaping how the next twenty years of TouchPoints could look like.
Our work with the IPA
We didn’t arrive to the event as mere guests. FloreData has been the IPA’s data partner for TouchPoints for over three years. We run the processing pipeline that turns each yearly release into usable tables, we maintain the data platform those tables live on, and we look after the people who query it.
That means we know the awkward parts. TouchPoints ships as fixed-width survey files that have to be decoded against a codebook. We expand the data into a diary panel of roughly 15.6 million rows across activities, locations, moods and media in half-hour slots. Consequently, we are familiar with the difficulties such expansive data can present to analysts. ChatPoints came directly out of solving those difficulties.
What is ChatPoints
The problem it solves
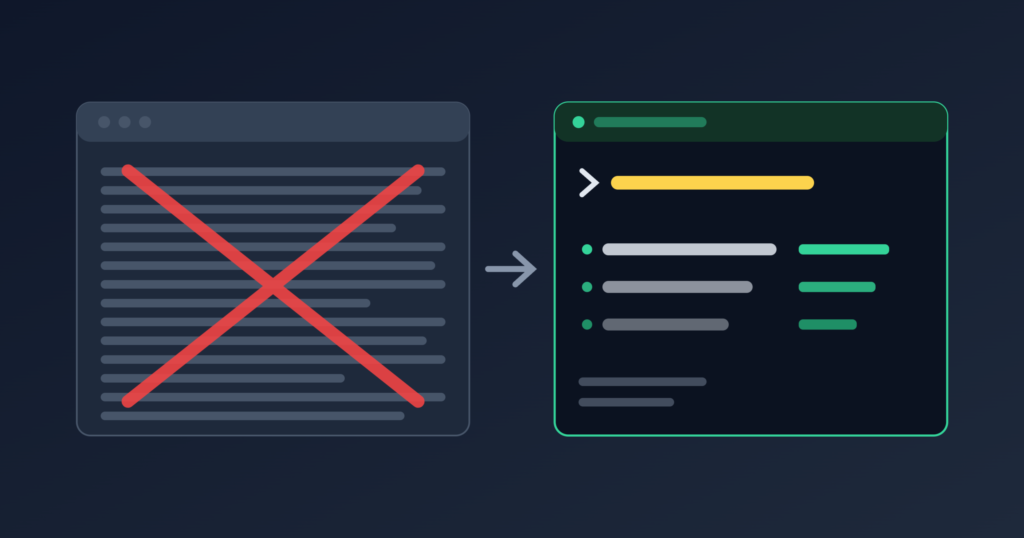
Analytics is a series of trade-offs. Speed or nuance. Domain knowledge or technical skill. Sophisticated metrics or free exploration. Normally you pick a corner and live with it.
The everyday version of that squeeze is familiar: your boss needs figures and charts for a meeting in fifteen minutes. Fifteen minutes is barely enough to find the right data, let alone analyse it and build a clean chart. So you rush, you make a mistake, and the wrong number ends up on the slide. ChatPoints exists to remove that scramble, to give you the nuanced answer and the speed, without needing to be both a TouchPoints expert and a structured query language (SQL) writer.
How it works
A plain language model knows nothing about TouchPoints. Ask it a question and it can’t tell you where the data sits, let alone let you check its answer. Closing that gap took three deliberate steps.
- Context. We give the model a base briefing on what TouchPoints is and how it’s structured (the manual, before it’s allowed to drive).
- A data model. Dumping a database at a language model just fills its context window and stalls the chat. Instead, we carve the raw survey into clean, signposted entities (“this is Out-of-Home”, “this is TV”, “this is radio”) and point the agent at them. It’s the same modelling work we already do for the platform.
- Tools. The agent gets a dictionary so it speaks the industry’s language, the ability to run SQL and draw charts so its figures come straight from the panel, and export tools that turn a conversation into a PDF, PowerPoint or Excel file.
In the demo, we asked for an interactive scattergraph of average dwell time against reach for commercial media channels. ChatPoints ran the query, wrote a short summary: Out-of-Home “in a league of its own,” a cluster of internet, TV and social media, radio holding the centre. Then it drew the chart. We also uploaded Les Binet’s Go Big or Go Home paper and asked it to add the missing channels; it did, colour-coded the additions without being told to, and noted where the panel agreed with Binet. Later we had it export the whole thing as a deck.
Grounded in the data, and honest about its limits
The point that landed hardest in the room was the transparency. Every answer comes with a plain-English methodology note, and if you want to scrutinise it, you can open the exact SQL the agent ran. Nothing is hidden, ChatPoints is verbose and transparent.
It’s also faithful to the source. Ask about something TouchPoints doesn’t measure and ChatPoints tells you it doesn’t have that, then offers a comparable measure that is in the panel, rather than inventing a confident-sounding figure. For a dataset whose value is its independence and accountability, an AI that refuses to hallucinate around it is the whole game.
Not just TouchPoints
TouchPoints is where we started, not where we stop. Our method is portable: brief the agent, model the data, hand it the right tools. We’ve fed ChatPoints full PDF case studies and asked it to reproduce the study against TouchPoints data; it worked out the methodology, flagged its assumptions, and rebuilt the analysis. The same approach can sit on your own data and your own problems. TouchPoints just happens to be the dataset we know best.
How did people react to ChatPoints
The response was better than we hoped. Simon Frazier of the IPA remarked “Game changing work Áron Gyenge and the FloreData team. Super exciting.” Dan Flynn of the IPA added: “Thanks for being part of it Aron and team. You did brilliantly, have been a pleasure to work with and we look forward to showing clients how powerful the tool can be.”
Two lines from the audience stuck with us. One attendee wrote that the highlight of the morning was “FloreData’s Áron Gyenge presenting Chatpoints, an LLM with TouchPoints data embedded at its core. From TouchPoints to ‘Chatpoints’ — genuinely exciting to see what an AI-powered future for TouchPoints could look like.” Another commented: “Epic work and unbelievably smart!”
Since the event, several agencies have started trials, and we’re in conversations about deeper integration.
Start your free ChatPoints trial
We built ChatPoints so it works for the largest agencies and for sole-trading consultants alike, at a price that doesn’t gatekeep. Trial slots are open now. If you’d like to put your own questions to TouchPoints, or talk about pointing the same approach at your own data, get in touch through the ChatPoints page.
FloreData is a data and AI consultancy and the IPA’s data partner for TouchPoints. See what we do on our services page, or start a conversation.